
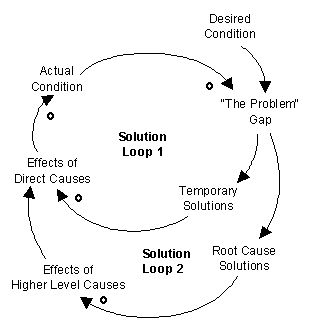
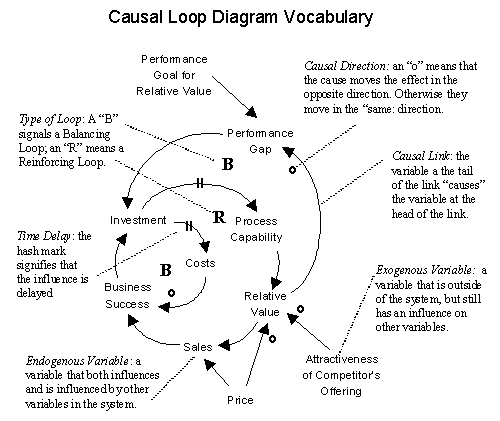
Use this advanced technique with VIS-IT™ Hexagons to create and share a “mental model” of the forces and factors at work in a complex system. A Causal Loop Diagram (CLD) is a powerful “systems thinking” tool that explicitly illustrates the “cause-effect-cause” relationships between the variables, which over time generate dynamic behaviors in complex systems. Variable names used in the CLD are written on hexagons, which are especially suited for this technique because they can be easily moved to adapt to the continuous modifications in thinking as a team builds a greater understanding of the system they are examining.
Features
- The VIS-IT™ Causal Loop Diagram Technique is a downloadable pdf document. After your order is completed, you will receive an email with a link to download the file. You may also access your account, and download directly from there.
Related products
-
 Create New Ideas Critical Thinking Make Decisions Solve problems Systems Thinking VIS-IT™ Tools Visioning with Groups
SIX-COLOR Set of VIS-IT™ Hexagon Pads 6×6 in. (300 sheets total)
$49.00 Add to cart -
 Create New Ideas Scenario Thinking Visioning with Groups
The VIS-IT™ Scenario Evaluation Matrix Technique
$0.00 Add to cart -
 Brainstorm Ideas Create New Ideas Critical Thinking Make Decisions Scenario Thinking Solve problems Systems Thinking Visioning with Groups
SIX-COLOR Set of VIS-IT™ 8×6 in. Big Idea Pads (300 sheets total)
$46.00 Add to cart

Reviews
There are no reviews yet.